
 ·
Daily Market Intelligence Report & Grade Change Digest · Session 2026-11-06
TopFlight Daily Market Intelligence Report (2026-11-06)
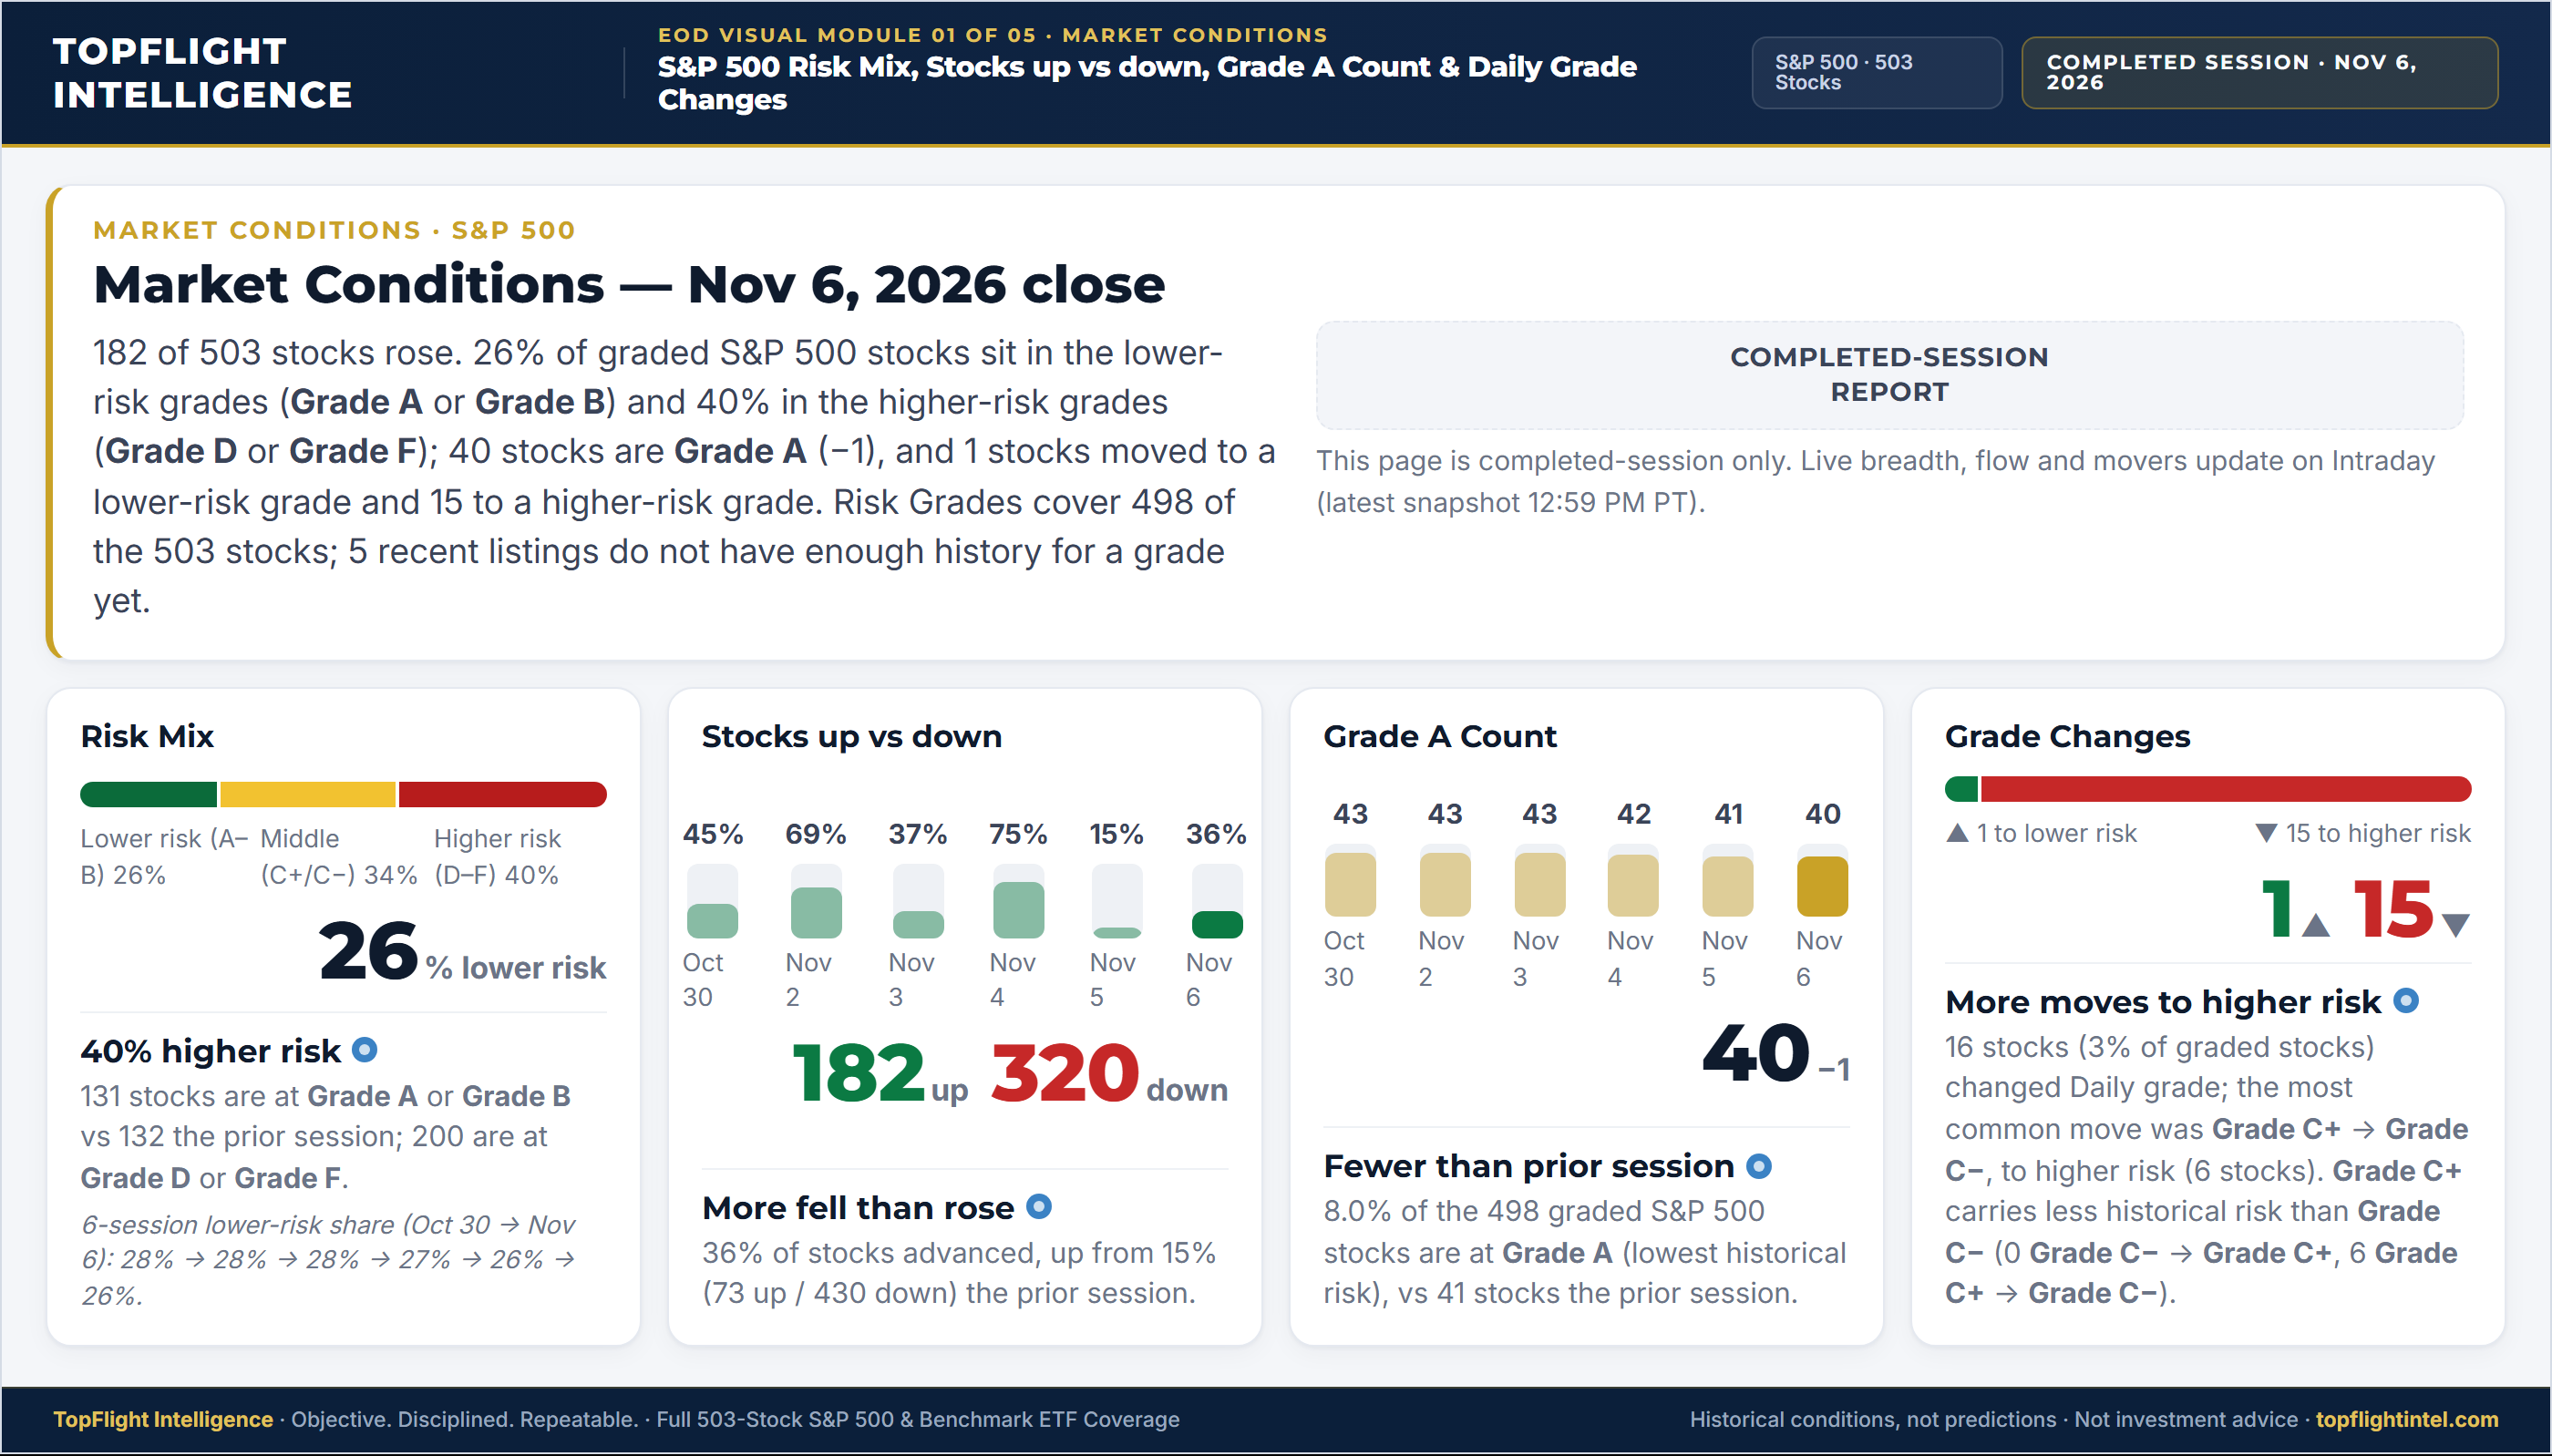
Risk picked up today. 16 of 498 graded stocks changed Risk Grade since the prior session, and more got riskier (15) than calmer (1). More stocks fell than rose (320 to 182), and the equal-weighted average stock fell in most sectors (10 of 11). Information Technology led and Consumer Staples lagged (typical stock’s move). Below: the full report in five short parts, each with its graphic.
📩 Get This Daily Intelligence Report Free Every Trading Day
Delivered after the close: the full write-up, all 5 graphics, $SPY & $QQQ grades, plus every S&P 500 & ETF grade change.
Lowest risk (ETF group) · $SPY 20-day swing 19.9% · Grade A: This fund has exhibited relatively low historical price volatility and drawdowns compared with higher-risk grades.
Low risk (ETF group) · $QQQ 20-day swing 32.0% · Grade B: This fund has exhibited relatively low-to-moderate historical price volatility and drawdowns compared with higher-risk grades.
Part 1 · Today at a glance
$SPY +0.31% · $IWM +0.99% · $QQQ +1.40%
Breadth was negative (182 advancing vs. 320 declining), with Information Technology the strongest sector and Consumer Staples the weakest by median performance.
16 of 498 graded stocks changed Risk Grade since the prior session, and more got riskier (15) than calmer (1).
More stocks fell than rose (320 to 182), and the equal-weighted average stock fell in most sectors (10 of 11). Information Technology led and Consumer Staples lagged (typical stock’s move).
More stocks moved into riskier grades than calmer ones. Check your stocks and watchlist to see whether any of yours were among them.
Details
3 of 4 major indexes rose: S&P 500 +0.31%, Nasdaq 100 +1.35%, Dow Jones −0.46%, Russell 2000 +0.89%.
The indexes lean on the biggest companies, so your own stocks can move differently. Their grades tell you more about them than the index does.
Details
182 stocks rose and 320 fell. The typical S&P 500 stock was down a little (−0.67%).
This counts how many stocks went up or down today. It's a price measure — Risk Grades are reported separately.
Details
40 S&P 500 stocks are Grade A, the lowest-risk grade. That's about 8% of the index, 1 fewer than the day before.
Grade A stocks are the ones that have swung and dropped the least in the past.
If any of your stocks or watchlist names are Grade A, they're in the calmest group right now.
Details
Part 2 · Trend and the risk mix
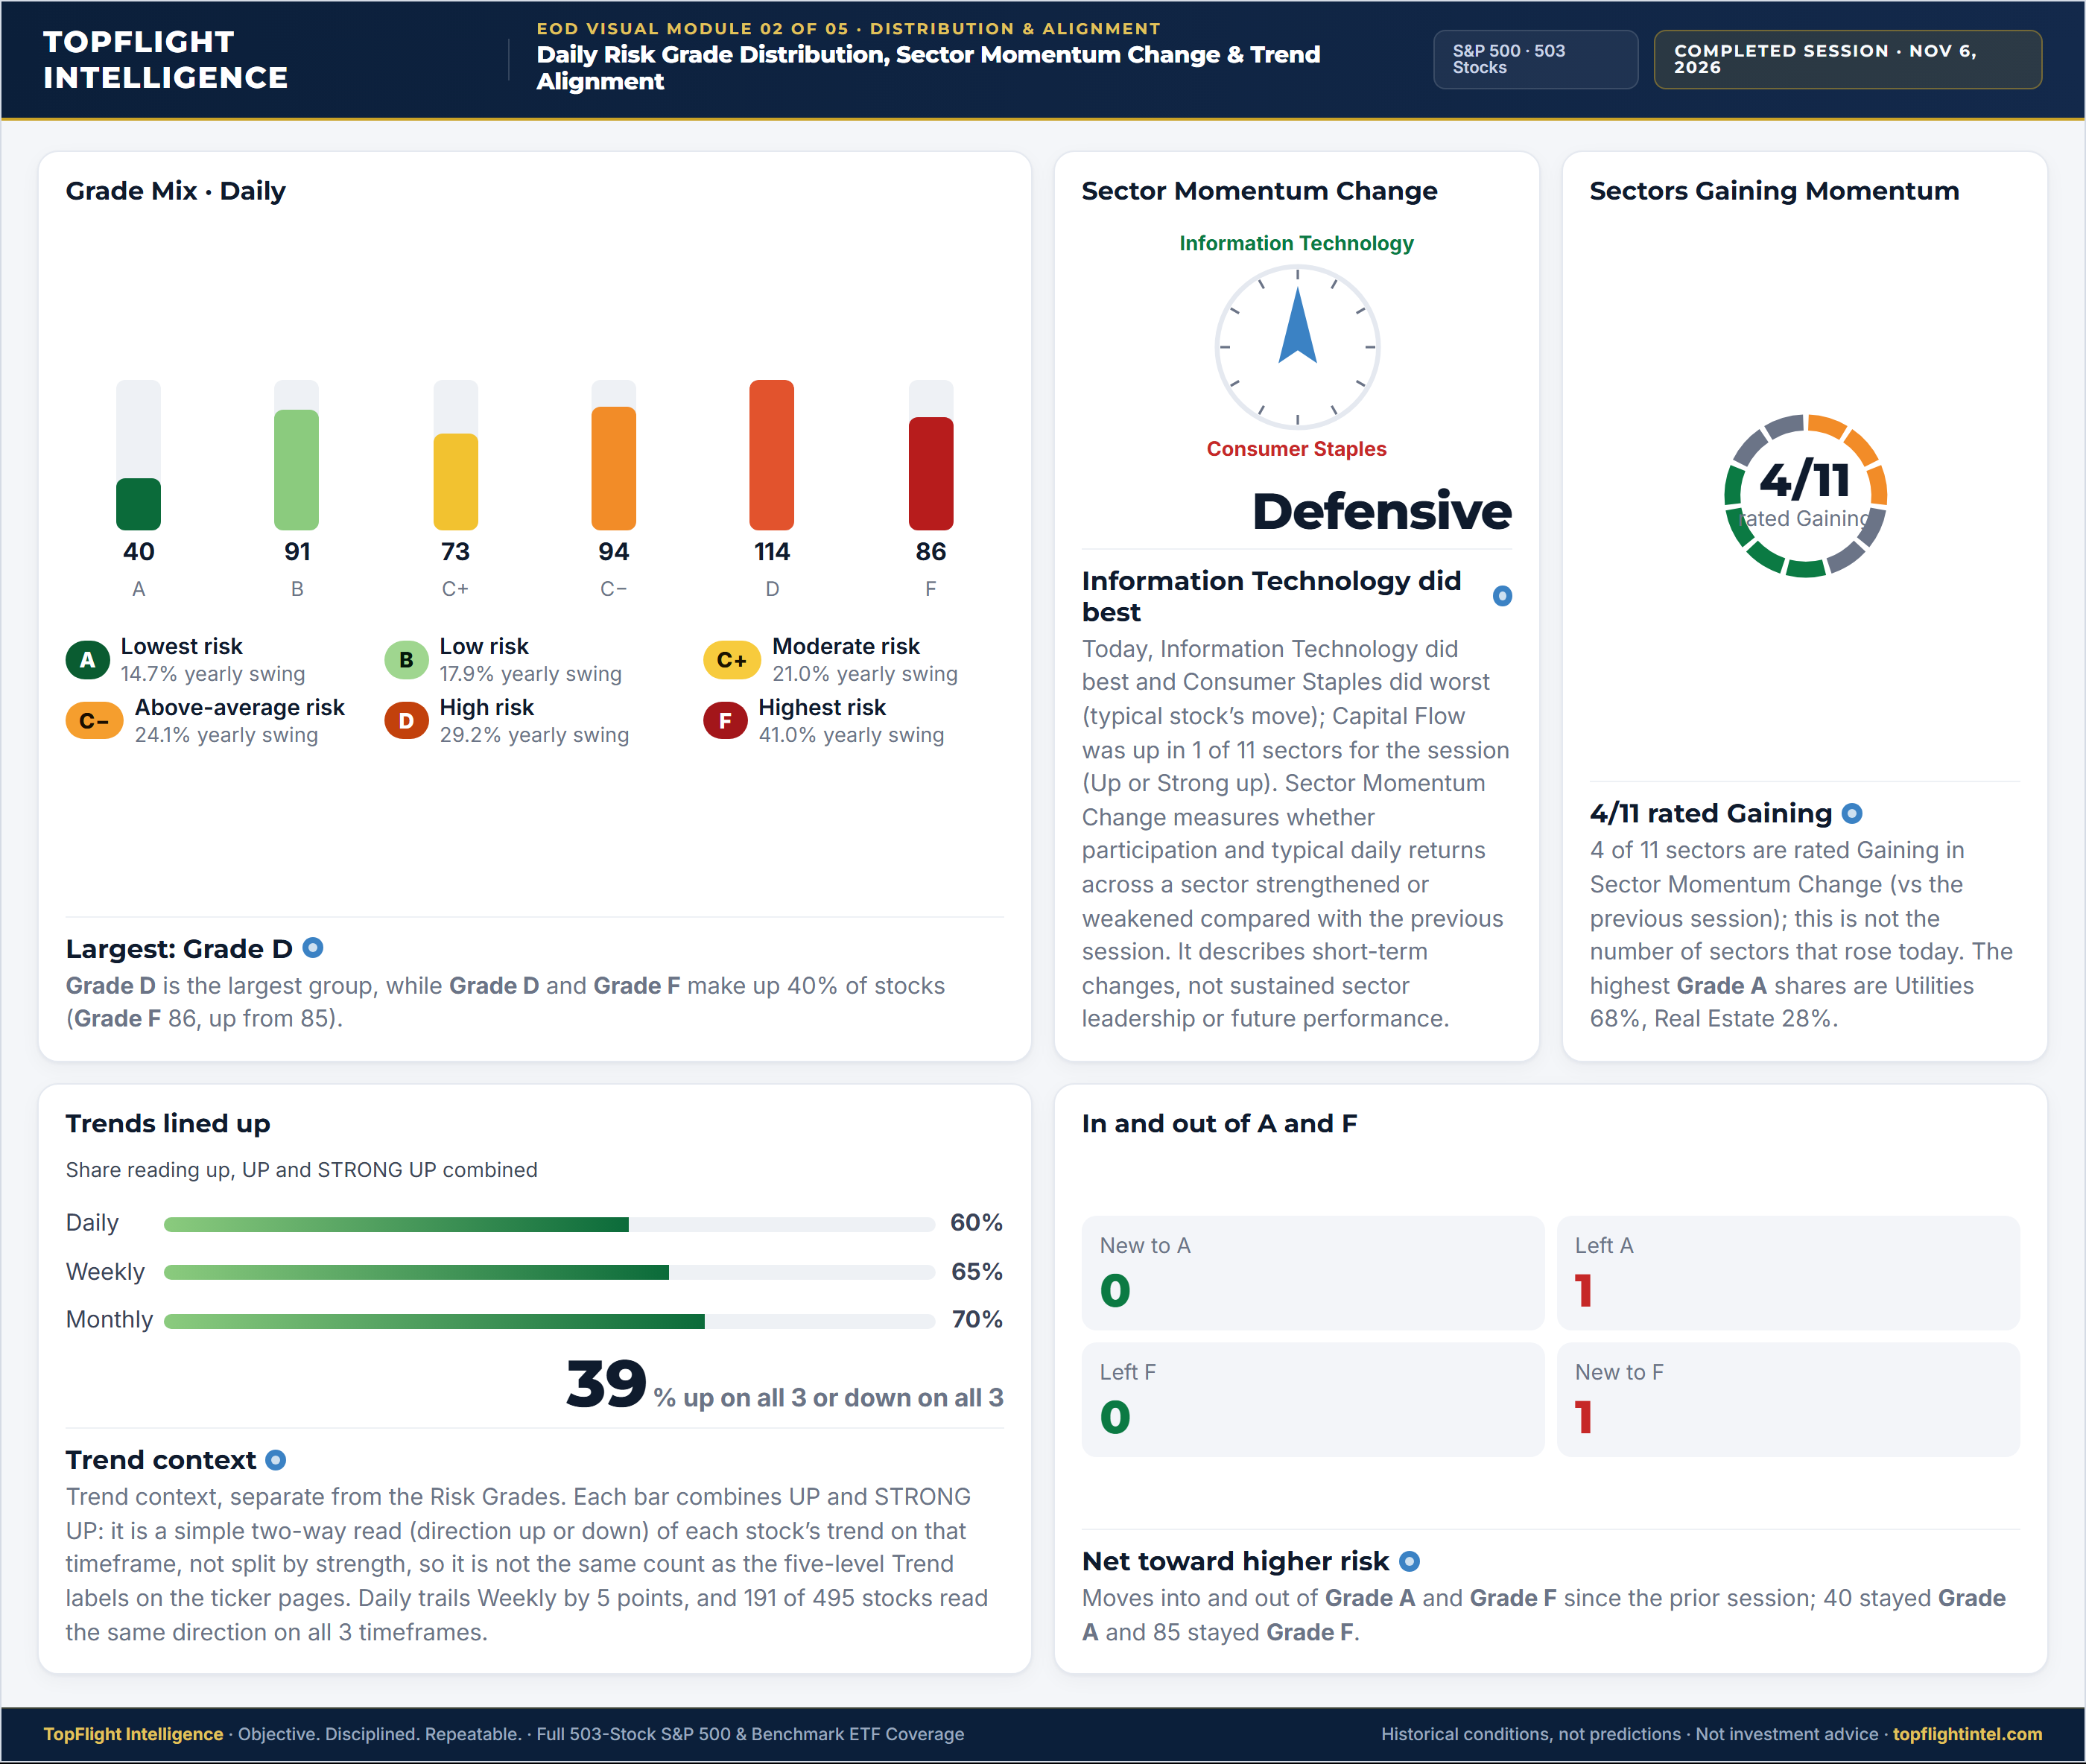
About 60% of stocks show an up trend (UP or STRONG UP) on the daily view, compared with 65% on the weekly view and 70% on the monthly view. The short-term picture is softer than the longer-term one.
About 31% of stocks show an up trend on all three views (daily, weekly and monthly).
Trend only shows direction, from STRONG UP to STRONG DOWN. It's separate from the Risk Grade, and your stocks and watchlist show both.
Details
26% of S&P 500 stocks are in the lower-risk grades (A or B), 34% are in the middle (C+ or C−), and 40% are in the higher-risk grades (D or F). There are more higher-risk stocks than lower-risk ones right now.
This is the mix of Risk Grades across all graded S&P 500 stocks, not any one stock or fund. Your own stocks’ grades show where each one fits.
Details
Part 3 · Grade changes and how Grade A did
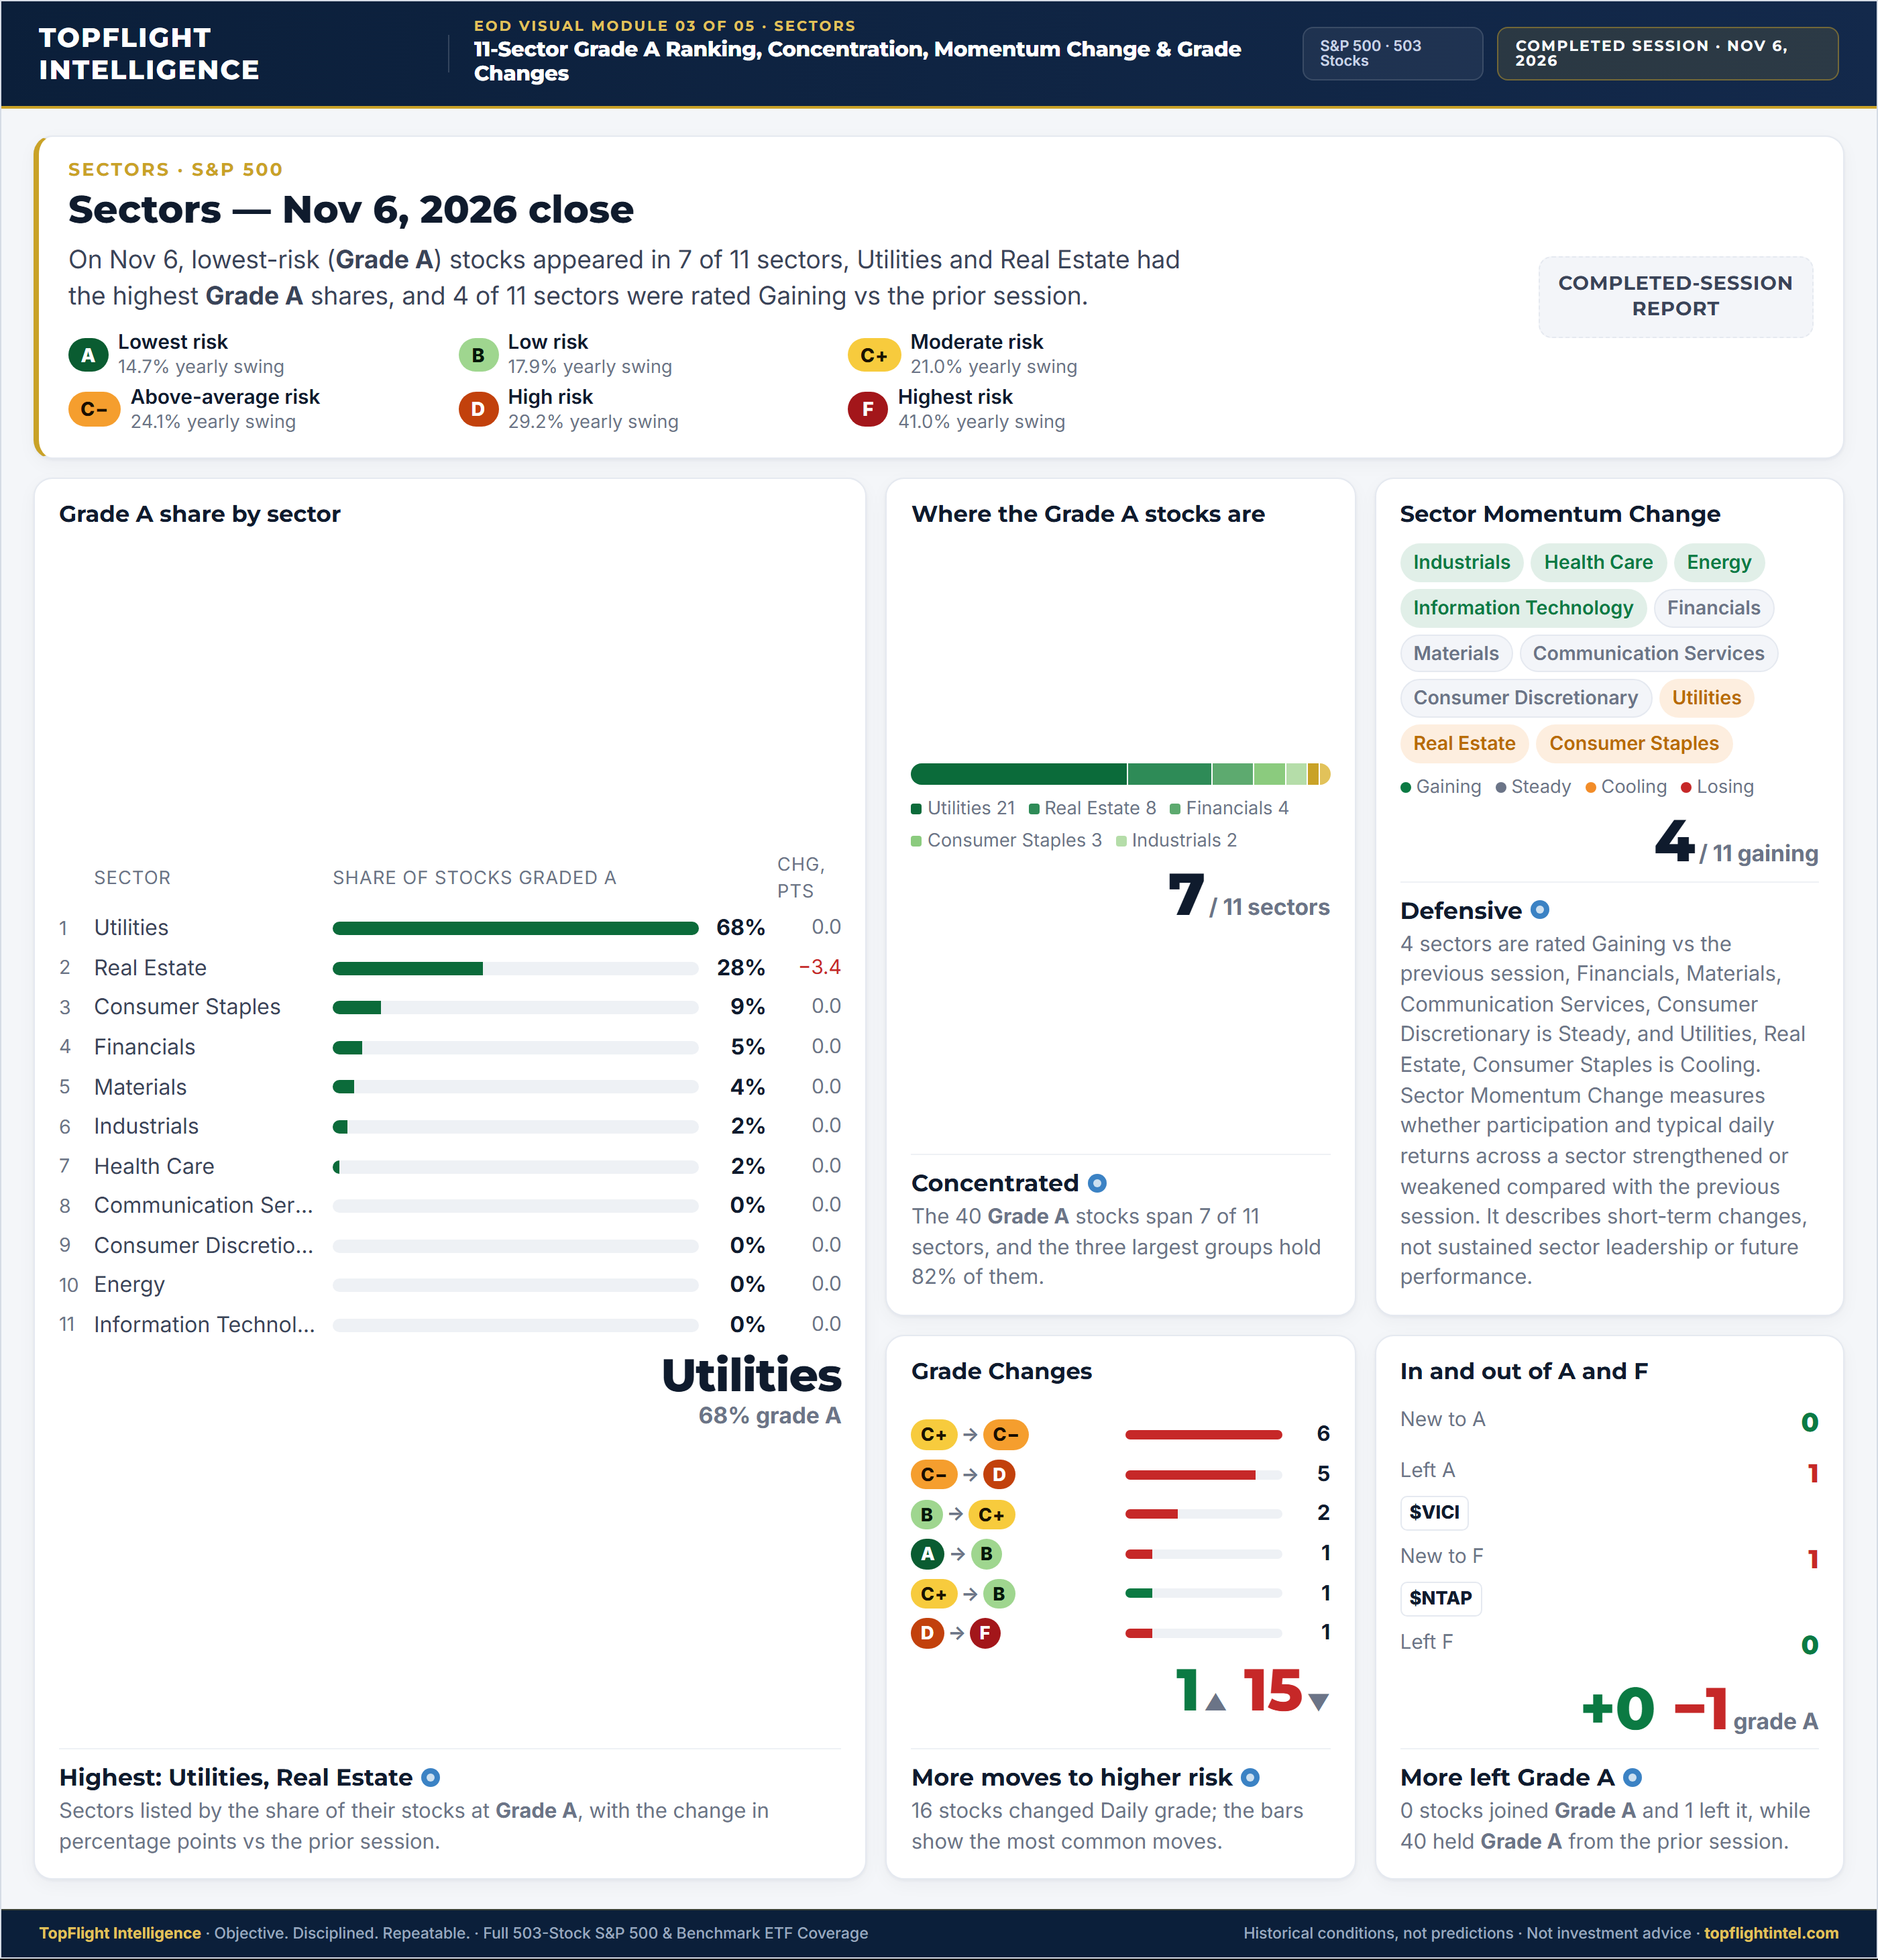
16 stocks changed Risk Grade since the prior session (3.2% of graded S&P 500 stocks): 1 moved to a lower-risk grade and 15 to a higher-risk grade.
Grade changes are rare by design — a typical stock changes grade about once every three to four months.
The full list is in the grade-change tables on this page. See whether any of your stocks or watchlist names are on it.
Details
Grade A stocks did worse than the market today: they averaged −0.88%, compared with −0.28% for the whole S&P 500 (9 rose, 31 fell).
Lower risk doesn't mean a stock rises every day. It means smaller swings and drops, based on the past.
One day's move doesn't change what a grade measures. For Grade A stocks, a quiet or down day is normal.
Details
Part 4 · Sectors and the biggest movers
Information Technology did best today: its typical stock rose 0.71%. Consumer Staples did worst today: its typical stock fell 1.47%.
Overall, the equal-weighted average stock rose in 1 of the 11 sectors today and fell in 10.
If your stocks are spread across sectors, this shows how each part of the market did today. It describes the day, not what comes next.
Details
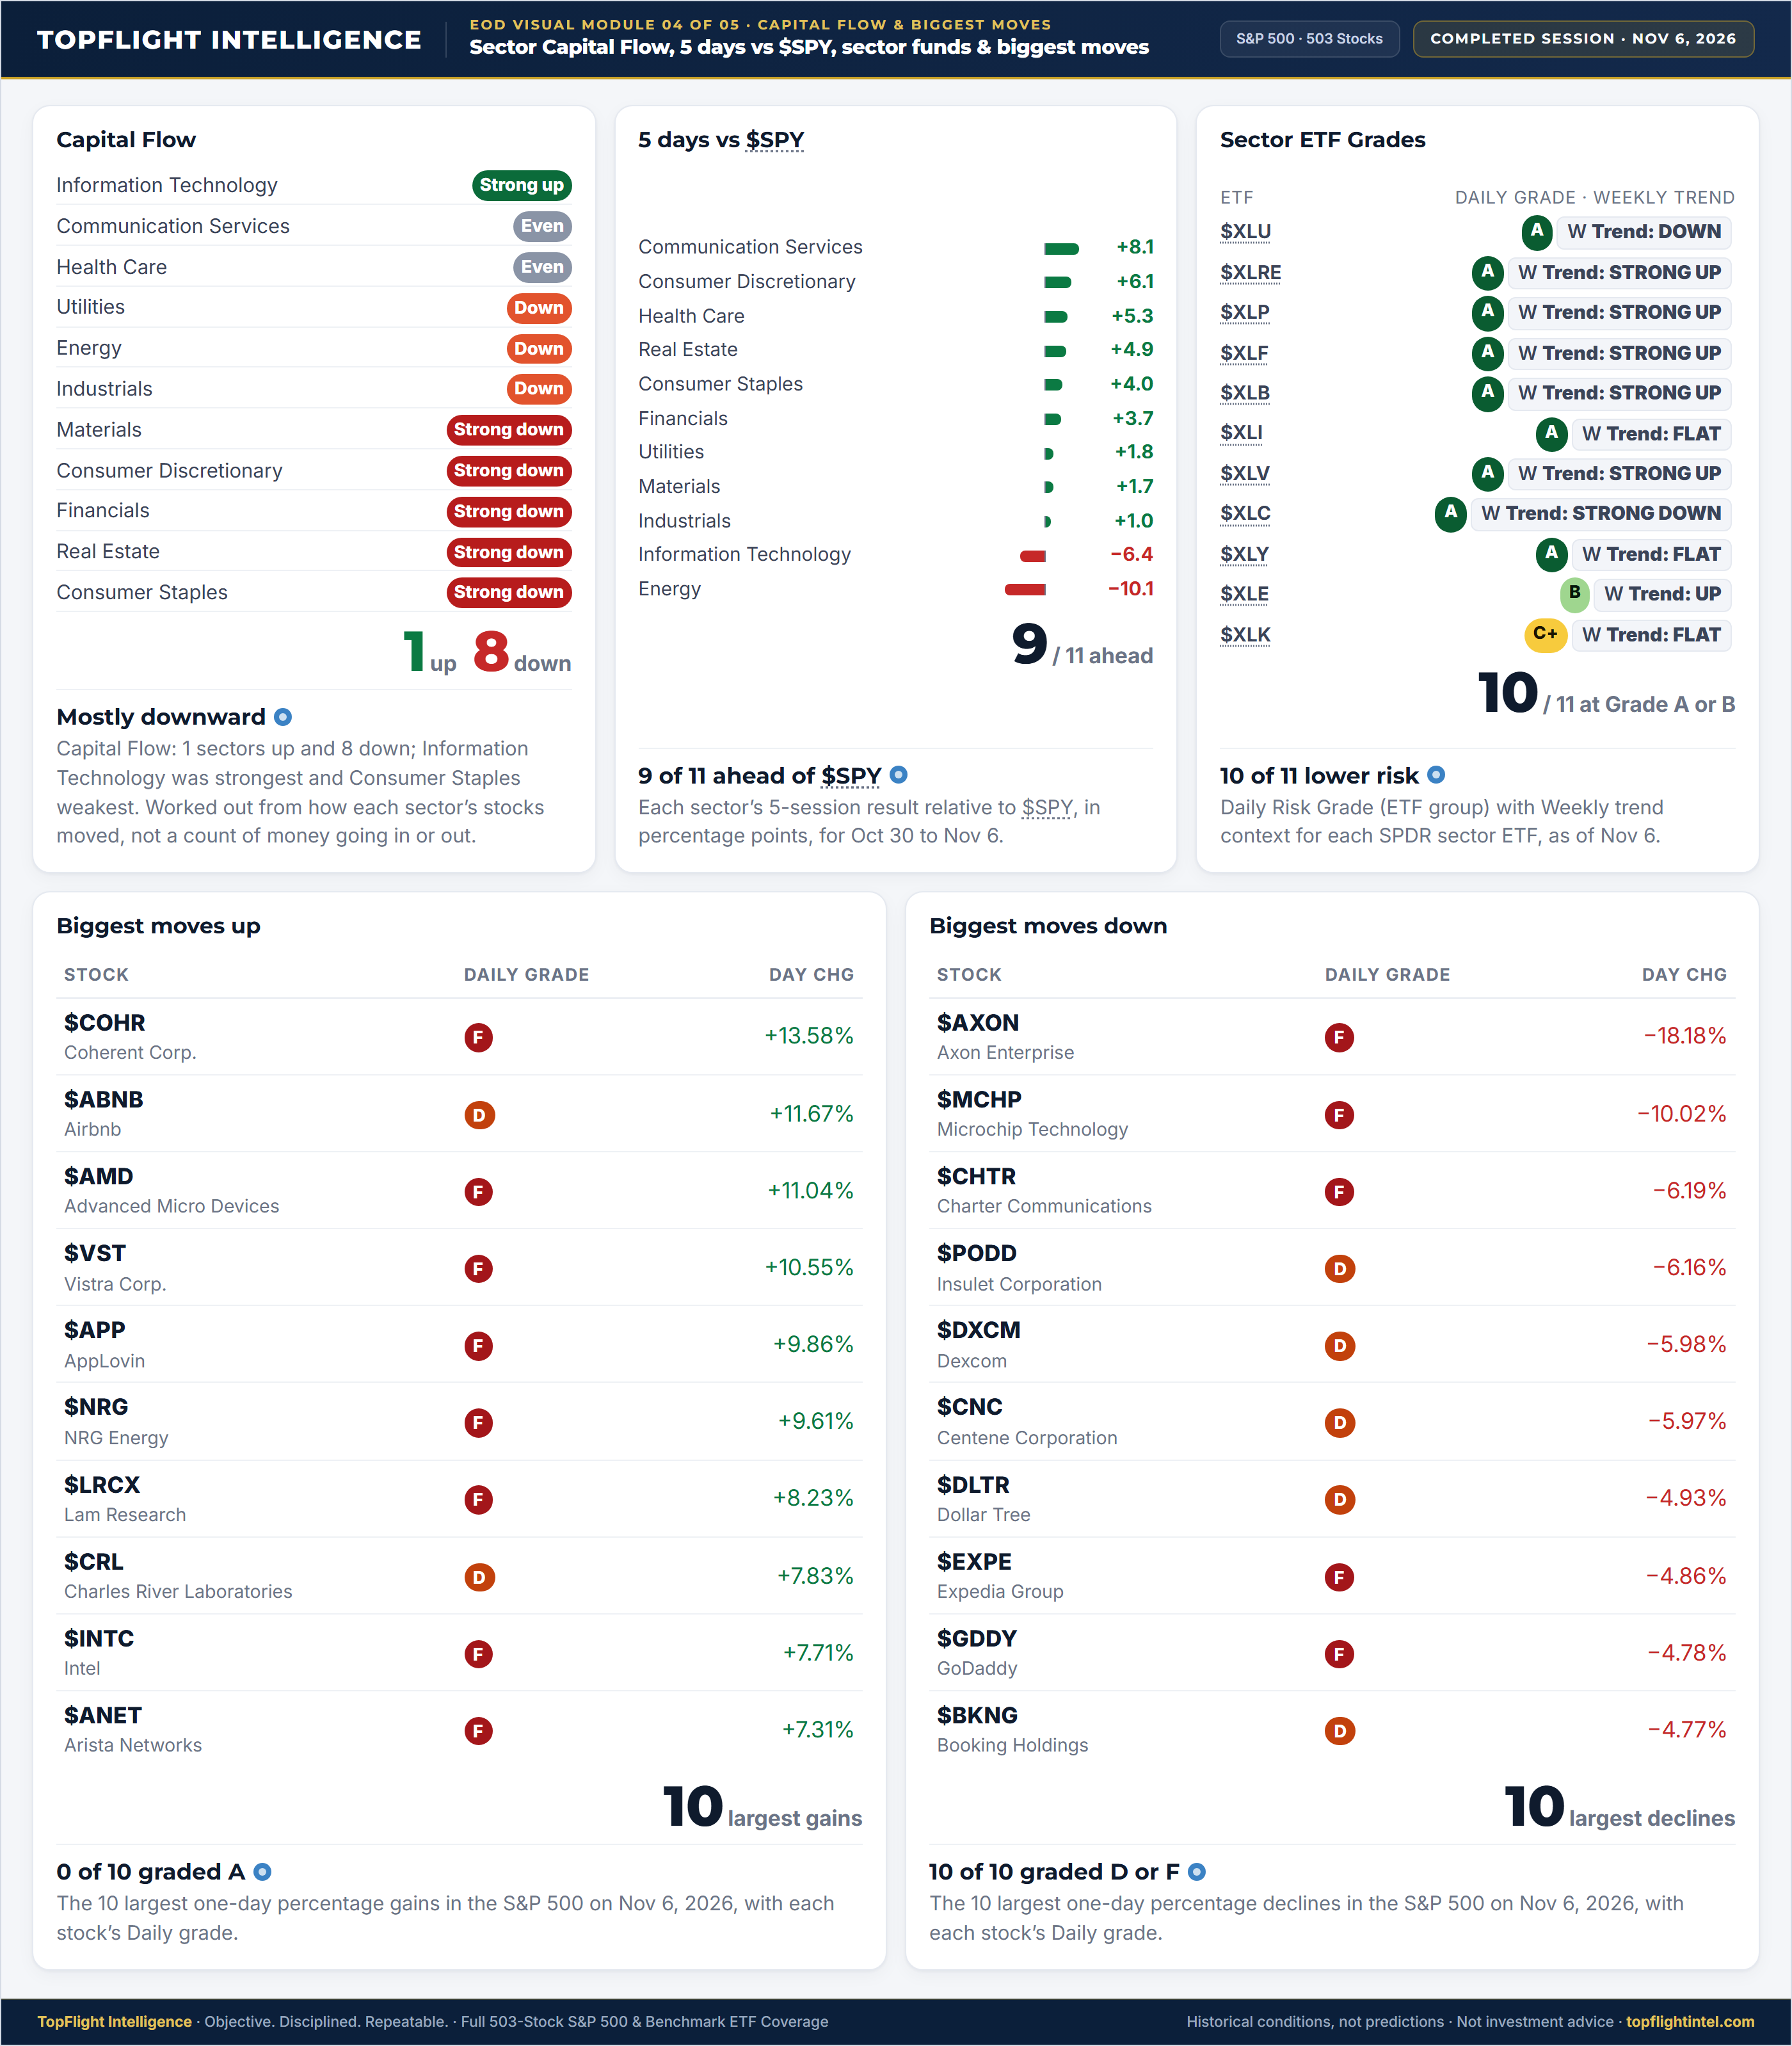
$COHR (Coherent Corp., Information Technology) was the biggest gainer in the S&P 500, up 13.58%. It's Grade F, the highest-risk grade.
Big one-day moves are common for higher-risk stocks — that's part of what puts them in those grades.
Details
$AXON (Axon Enterprise, Industrials) had the biggest drop in the S&P 500, down 18.18%. It's Grade F, the highest-risk grade.
Big one-day moves are common for higher-risk stocks — that's part of what puts them in those grades.
Details
Part 5 · Funds (ETFs) and the bottom line
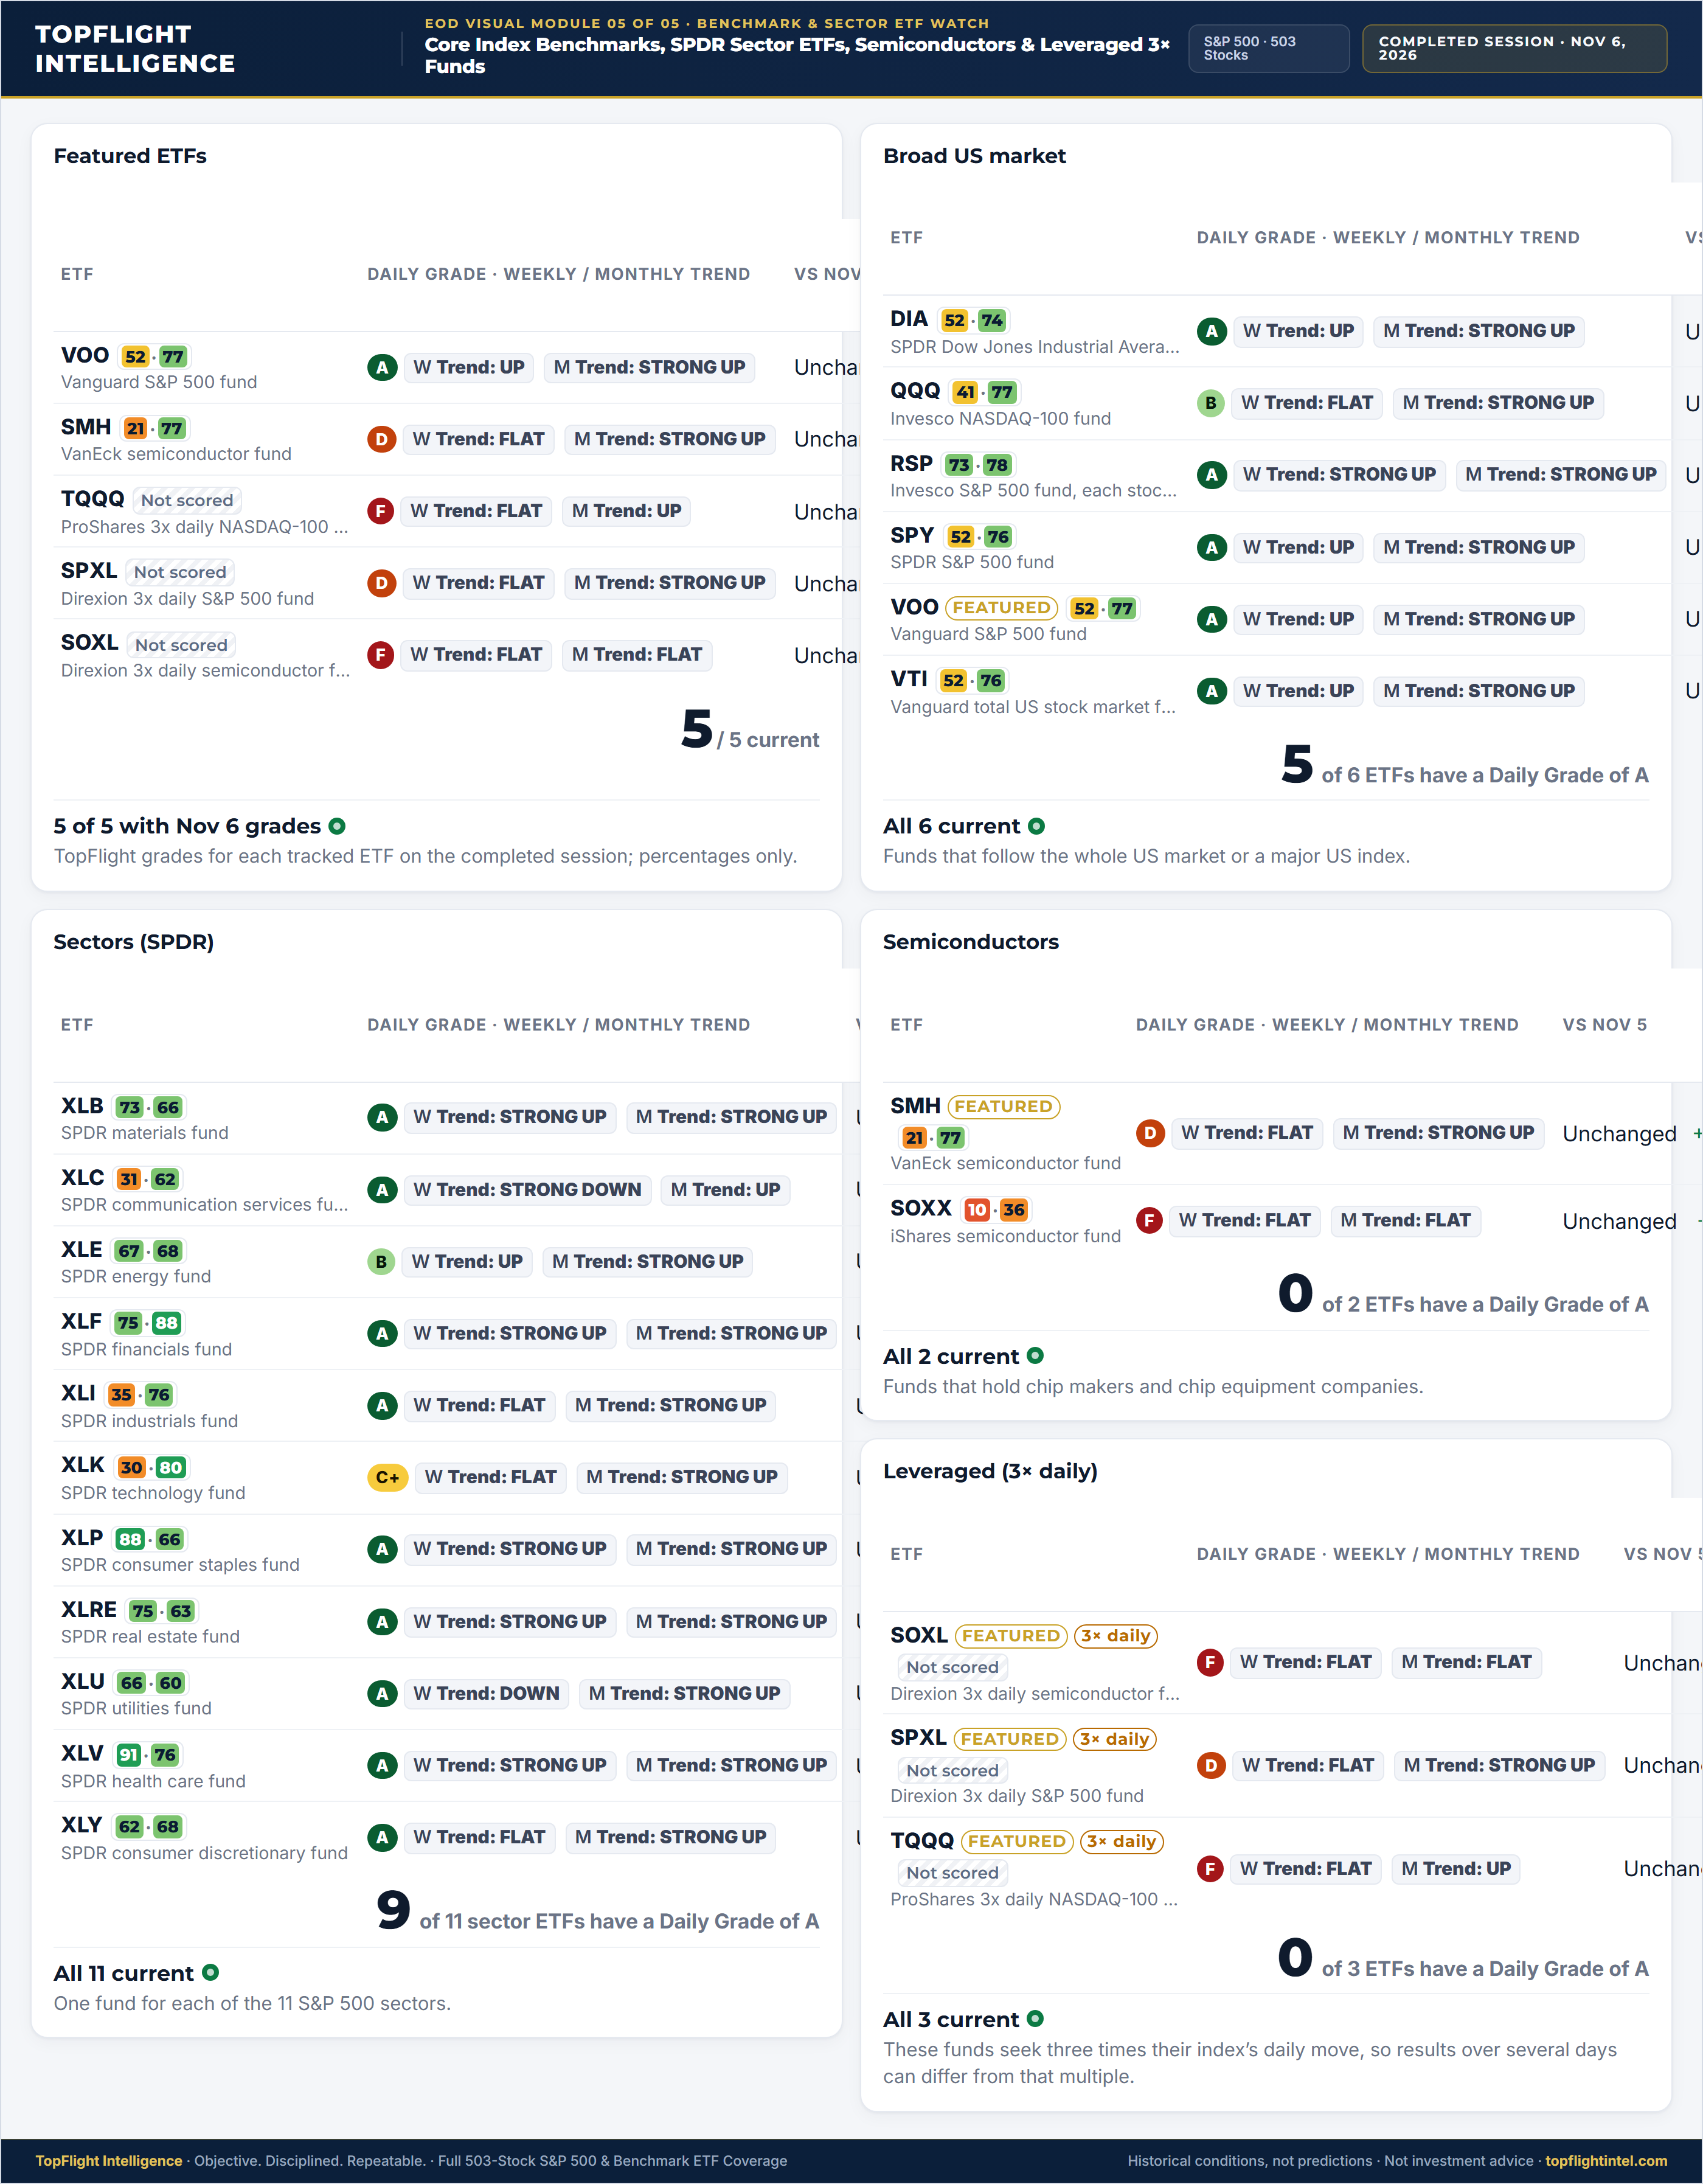
5 of 6 broad-market funds rose ($SPY, $VOO, $VTI, $DIA, $QQQ, $IWM).
Among the sector funds, $XLK did best (+1.45%) and $XLP did worst (−1.28%).
Chip funds moved more than the broad market: $SMH +3.62%, $SOXX +3.51%.
Funds get the same Risk Grades as stocks. If you own funds, the fund table shows each one's grade.
Details
Grade A stocks trailed the market by 0.60 percentage points today.
This describes today, not what comes next.
Details
Risk picked up today. More stocks fell than rose (320 to 182), 40 stocks are Grade A, and 16 changed grade.
TopFlight grades describe past risk — how much a stock has swung and dropped. They don't say where it's headed.
Your own stocks’ grades are on Check my stocks and your Watchlist.
Part 6 · Every S&P 500 & ETF grade change and the longest streaks
Star any ticker below to build a custom browser Watchlist with Daily Risk Grades, Weekly/Monthly trend context, grade-change status vs Nov 5, streak length, and 1D / 20D performance.
▲ Moves to Lower Risk (1) Moved up the A → B → C+ → C− → D → F scale
Every stock and ETF whose Daily grade improved on Nov 6 vs Nov 5, ordered by new grade. Click ★ to watch any ticker.
| Ticker | Grade change (Nov 5 → Nov 6) | W · M | 1D % | 20D % | Sector / Group |
|---|---|---|---|---|---|
| MAR Marriott International S&P + NDX | ▲ C+ → B | Trend: STRONG UP · Trend: STRONG UP | −0.19% | +13.83% | Consumer Discretionary |
▼ Moves to Higher Risk (15) Moved down the A → B → C+ → C− → D → F scale
Every stock and ETF whose Daily grade weakened on Nov 6 vs Nov 5. Click ★ to watch any ticker.
| Ticker | Grade change (Nov 5 → Nov 6) | W · M | 1D % | 20D % | Sector / Group |
|---|---|---|---|---|---|
| NTAP NetApp S&P 500 | ▼ D → F | Trend: UP · Trend: STRONG UP | −0.11% | −28.66% | Information Technology |
| IVZ Invesco S&P 500 | ▼ C− → D | Trend: FLAT · Trend: STRONG UP | 0.00% | −8.23% | Financials |
| REGN Regeneron Pharmaceuticals S&P + NDX | ▼ C− → D | Trend: STRONG UP · Trend: STRONG UP | +0.16% | +21.14% | Health Care |
| IRM Iron Mountain S&P 500 | ▼ C− → D | Trend: FLAT · Trend: UP | +0.97% | −6.98% | Real Estate |
| GE GE Aerospace S&P 500 | ▼ C− → D | Trend: STRONG UP · Trend: STRONG UP | +2.70% | +4.88% | Industrials |
| CVS CVS Health S&P 500 | ▼ C− → D | Trend: FLAT · Trend: STRONG UP | +3.10% | −2.68% | Health Care |
| WY Weyerhaeuser S&P 500 | ▼ C+ → C− | Trend: STRONG DOWN · Trend: STRONG DOWN | −3.01% | +9.84% | Real Estate |
| MS Morgan Stanley S&P 500 | ▼ C+ → C− | Trend: FLAT · Trend: STRONG UP | −0.55% | −4.52% | Financials |
| NWS News Corp (Class B) S&P 500 | ▼ C+ → C− | Trend: FLAT · Trend: UP | −0.03% | −9.53% | Communication Services |
| J Jacobs Solutions S&P 500 | ▼ C+ → C− | Trend: STRONG UP · Trend: STRONG UP | +0.92% | +7.01% | Industrials |
| EOG EOG Resources S&P 500 | ▼ C+ → C− | Trend: STRONG UP · Trend: STRONG UP | +1.55% | −0.70% | Energy |
| SOLV Solventum S&P 500 | ▼ C+ → C− | Trend: STRONG UP · Not available | +3.67% | +3.54% | Health Care |
| ABT Abbott Laboratories S&P 500 | ▼ B → C+ | Trend: FLAT · Trend: STRONG DOWN | −3.23% | +10.37% | Health Care |
| TDY Teledyne Technologies S&P 500 | ▼ B → C+ | Trend: UP · Trend: STRONG UP | +4.54% | +0.81% | Information Technology |
| VICI Vici Properties S&P 500 | ▼ A → B | Trend: STRONG DOWN · Trend: STRONG DOWN | −1.67% | +8.35% | Real Estate |
★ Multi-Session Grade A Longest Streaks Grade A streaks
Stocks and ETFs that stayed, session after session, in Grade A (lowest risk), ordered by streak length and 20-day change.
| Ticker | D · W · M | Grade A Streak | 1D % | 20D % | Sector / Group |
|---|---|---|---|---|---|
| COST Costco S&P 500 | A W Trend: STRONG UP · M Trend: STRONG UP | 19 sessions | −1.13% | +11.26% | Consumer Staples |
| ETR Entergy S&P 500 | A W Trend: STRONG UP · M Trend: STRONG UP | 9 sessions | +0.23% | +7.54% | Utilities |
⚠ Multi-Session Grade F Longest Streaks Grade F streaks
Stocks and ETFs that stayed, session after session, in Grade F, ordered by streak length and biggest 20-day drop.
| Ticker | D · W · M | Grade F Streak | 1D % | 20D % | Sector / Group |
|---|---|---|---|---|---|
| DASH DoorDash S&P 500 | F W Trend: STRONG DOWN · M Trend: UP | 15 sessions | −0.14% | −8.56% | Consumer Discretionary |
| SOXL Direxion 3x daily semiconductor fund ETF | F W Trend: FLAT · M Trend: FLAT | 13 sessions | +12.48% | −67.11% | ETF · Leveraged (3× daily) |
| ACN Accenture S&P 500 | F W Trend: FLAT · M Trend: DOWN | 9 sessions | −1.76% | +24.61% | Information Technology |
| CSGP CoStar Group S&P 500 | F W Trend: STRONG DOWN · M Trend: STRONG DOWN | 7 sessions | −4.68% | +2.97% | Real Estate |
| FTNT Fortinet S&P 500 | F W Trend: FLAT · M Trend: STRONG UP | 6 sessions | −3.00% | −38.98% | Information Technology |
| OKTA Okta Inc. S&P 500 | F W Trend: STRONG UP · M Trend: STRONG UP | 5 sessions | −1.44% | −27.33% | Information Technology |
| FFIV F5, Inc. S&P 500 | F W Trend: FLAT · M Trend: UP | 3 sessions | −0.29% | −35.22% | Information Technology |
| PWR Quanta Services S&P 500 | F W Trend: FLAT · M Trend: STRONG UP | 3 sessions | +6.25% | −23.38% | Industrials |
| HPQ HP Inc. S&P 500 | F W Trend: UP · M Trend: FLAT | 3 sessions | −3.33% | −5.76% | Information Technology |
Key ETF Risk Grade Monitor (Nov 6) 0 ETF grade changes vs Nov 5
Broad market, style, sector, bond, metal, and leveraged ETFs tracked on TopFlight ETF Watch.
| ETF | Daily grade · Weekly / Monthly trend | vs Nov 5 | Streak | 1D % | 20D % |
|---|---|---|---|---|---|
| SPY SPDR S&P 500 fund | A W Trend: UP · M Trend: STRONG UP | Unchanged (A) | 20+ sessions | +0.31% | −5.56% |
| QQQ Invesco NASDAQ-100 fund | B W Trend: FLAT · M Trend: STRONG UP | Unchanged (B) | 2 sessions | +1.40% | −12.67% |
| VOO Vanguard S&P 500 fund | A W Trend: UP · M Trend: STRONG UP | Unchanged (A) | 20+ sessions | +0.30% | −5.53% |
| IWM iShares Russell 2000 small-company fund | A W Trend: FLAT · M Trend: STRONG UP | Unchanged (A) | 20+ sessions | +0.99% | −1.89% |
| DIA SPDR Dow Jones Industrial Average fund | A W Trend: UP · M Trend: STRONG UP | Unchanged (A) | 20+ sessions | −0.40% | −0.75% |
| SMH VanEck semiconductor fund | D W Trend: FLAT · M Trend: STRONG UP | Unchanged (D) | 20+ sessions | +3.62% | −23.10% |
| XLK SPDR technology fund | C+ W Trend: FLAT · M Trend: STRONG UP | Unchanged (C+) | 5 sessions | +1.45% | −17.12% |
| XLF SPDR financials fund | A W Trend: STRONG UP · M Trend: STRONG UP | Unchanged (A) | 20+ sessions | −0.59% | +4.44% |
| XLE SPDR energy fund | B W Trend: UP · M Trend: STRONG UP | Unchanged (B) | 20+ sessions | −0.02% | −5.32% |
| XLV SPDR health care fund | A W Trend: STRONG UP · M Trend: STRONG UP | Unchanged (A) | 20+ sessions | −0.06% | +8.19% |
| XLY SPDR consumer discretionary fund | A W Trend: FLAT · M Trend: STRONG UP | Unchanged (A) | 20+ sessions | −0.05% | +4.19% |
| GLD SPDR gold fund | B W Trend: STRONG DOWN · M Trend: STRONG UP | Unchanged (B) | 8 sessions | −0.79% | −3.14% |
| TLT iShares 20+ year Treasury bond fund | A W Trend: STRONG DOWN · M Trend: STRONG DOWN | Unchanged (A) | 20+ sessions | −0.01% | +5.05% |
| TQQQ ProShares 3x daily NASDAQ-100 fund | F W Trend: FLAT · M Trend: UP | Unchanged (F) | 20+ sessions | +3.54% | −35.72% |
TopFlight Market Intelligence grades describe how the market has behaved (trends, risk and how much stocks have swung) using TopFlight’s own method. TopFlight is not a prediction model, and its grades do not provide instructions, recommendations, or individualized investment advice regarding any security.
All information contained in this report is provided for educational and informational purposes only. Past results and past swings don’t guarantee future results. Stocks, grades, sector readings and trends change as each completed session comes in.
Source: Validated completed-session TopFlight S&P 500 data, 503-security completeness required.